

https://doi.org/10.3390/ma15072540
”
XPS Principle and Experimental Details
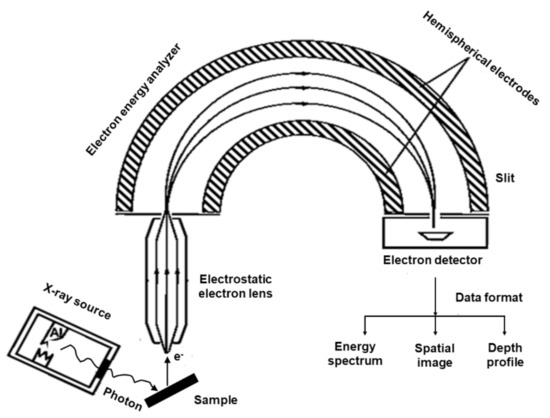
Typical XPS spectra represent intensity versus EB, where the intensity area reveals the concentration and binding energy reveals the speciation. The spectrum reveals the electron energy distribution in the material. The position and height (intensity) of each peak in the photoelectron spectrum provide the desired information on the chemical state, elemental composition, empirical formula determination, electronic state, and oxidation state of the sample surface. These data are used to determine the binding energy of the ejected electron to obtain information about the electronic structure using the equation:
where h is the Planck constant (6.63 × 10⁻³⁴ J s), ν is the frequency (Hz) of radiation, EB is the electron binding energy, Ekin is the kinetic energy of freed electrons, and ΦΦ is the work function. Binding energy is an important parameter in the XPS analysis to obtain information about the electronic structure. The work function of the material is the difference between the Fermi level (EF��) and the vacuum level (Evac����). For an electron to be ejected or emitted from the solid, the energy of the photoelectron must be sufficient to overcome its attraction to the material or ΦΦ of the material. Table 1 represents the binding energy levels from the ejected electron and their corresponding orbital from which the electrons are ejected for selected elements.
| Elements | Binding Energy (eV) | ||||||||
|---|---|---|---|---|---|---|---|---|---|
| 1s | 2s | 2p1/2 | 2p3/2 | 3s | 3p1/2 | 3p3/2 | 3d3/2 | 3d5/2 | |
| La | 38,925 | 6266 | 5891 | 5483 | 1362 | 1209 | 1128 | 853 | 836 |
| Sr | 16,105 | 2216 | 2007 | 1904 | 358.7 | 280.3 | 270 | 136 | 134.2 |
| Ba | 37,441 | 5989 | 5627 | 5247 | 1293 | 1137 | 1063 | 795.7 | 780.5 |
| Sm | 46,834 | 7737 | 7312 | 6716 | 1723 | 1541 | 1420 | 1110.9 | 1083.4 |
| Gd | 50,239 | 8376 | 7930 | 7243 | 1881 | 1688 | 1544 | 1221.9 | 1189.6 |
| Y | 17,038 | 2373 | 2156 | 2080 | 392 | 310.6 | 298.8 | 157.7 | 155.8 |
| Zr | 17,998 | 2532 | 2307 | 2223 | 430.3 | 343.5 | 329.8 | 181.1 | 178.8 |
| Nb | 18,986 | 2698 | 2465 | 2371 | 466.6 | 376.1 | 360.6 | 205 | 202.3 |
| Tb | 51,996 | 8708 | 8252 | 7514 | 1968 | 1768 | 1611 | 1276.9 | 1241.1 |
| Pd | 24,350 | 3604 | 3330 | 3173 | 671.6 | 559.9 | 532.3 | 340.5 | 335.2 |
| Co | 7709 | 925.1 | 793.2 | 778.1 | 101 | 58.9 | 58.9 | – | – |
| Fe | 7112 | 844.6 | 719.9 | 706.8 | 91.3 | 52.7 | 52.7 | – | – |
| Ni | 8333 | 1008.6 | 870 | 852.7 | 110.8 | 68 | 67.2 | – | – |
| Cr | 5989 | 696 | 583.8 | 574.1 | 74.1 | 42.2 | 42.2 | – | – |
| Ca | 4038.5 | 438.4 | 349.7 | 346.2 | 44.3 | 25.4 | 25.4 | – | – |
| Mn | 6539 | 769.1 | 649.4 | 638.7 | 82.3 | 47.2 | 47.2 | – | – |
| O | 531 | 22 | – | – | – | – | – | – | – |
“