

![[Garrone, E., Delgado, M. R., Bonelli, B. & Arean, C. O. (2017). Molecules, 22, 1557.]](https://journals.iucr.org/logos/arrows/a_arr.gif "Garrone, E., Delgado, M. R., Bonelli, B. & Arean, C. O. (2017). Molecules, 22, 1557.") ; Garrone & Areán, 2005), using the refined occupancies as an indicator of CO2 adsorption. The calculation of these parameters is possible because the timing of the experiment, described in Section 3, allowed collection of each data set at equilibrium, without evident evolution of the system during individual measurements. This is confirmed and demonstrated by the good values of Rint and R(sigma) [see Fig. S2 (top)] of each data set (they would be higher and more irregular in the temperature range where adsorption occurs if the system were evolving within the same data set). Moreover the 2D raw data frames collected at the beginning and at the end of the data set would have given many inconsistent intensities for equivalent reflections [Fig. S2 (bottom)] if the system were evolving.
; Garrone & Areán, 2005), using the refined occupancies as an indicator of CO2 adsorption. The calculation of these parameters is possible because the timing of the experiment, described in Section 3, allowed collection of each data set at equilibrium, without evident evolution of the system during individual measurements. This is confirmed and demonstrated by the good values of Rint and R(sigma) [see Fig. S2 (top)] of each data set (they would be higher and more irregular in the temperature range where adsorption occurs if the system were evolving within the same data set). Moreover the 2D raw data frames collected at the beginning and at the end of the data set would have given many inconsistent intensities for equivalent reflections [Fig. S2 (bottom)] if the system were evolving.Therefore, the van ‘t Hoff equation can be exploited to obtain the thermodynamic parameters of the process. The equation in its linearized form [equation (2) in the supporting information] was used to build the plot in Fig. 5. The total CO2 occupancies from were used to calculate θ, i.e. the fraction of occupied adsorption sites. The slope and the intercept, obtained from linear regression, together with their standard deviation, allowed us to calculate [see equation (2) in the supporting information] the values of ΔH = −32 ± 3 kJ mol−1 and ΔS = −100 ± 10 J Kmol−1, using the data from 234 to 290 K, thus eliminating the low and high temperatures where occupancies are asymptotically constant. This range was selected by visual inspection (Fig. 3) and further confirmed by the best R2 value in the interpolation of the van ‘t Hoff equation (Fig. 5). The values are in agreement with data reported for CO2 in MFI zeolite (Armandi et al., 2009). The corresponding plot obtained using the PC1 scores as CO2 amount estimator is reported in Fig. 5 (after switching the sign according to a priori knowledge that adsorption is exothermic) and gives an approximate value of ΔH = −52 ± 1 kJ mol−1 and ΔS = −196 ± 6 J Kmol−1. The difference compared with values obtained by the occupancy data from is important, but obtaining the same order of magnitude with a totally blind and much faster method, not requiring a priori information on the is noteworthy. PCA can thus be a very efficient tool to obtain thermodynamic parameters by PCA applied on raw data as soon as they are collected, useful as a preliminary investigation and data-quality check. ”
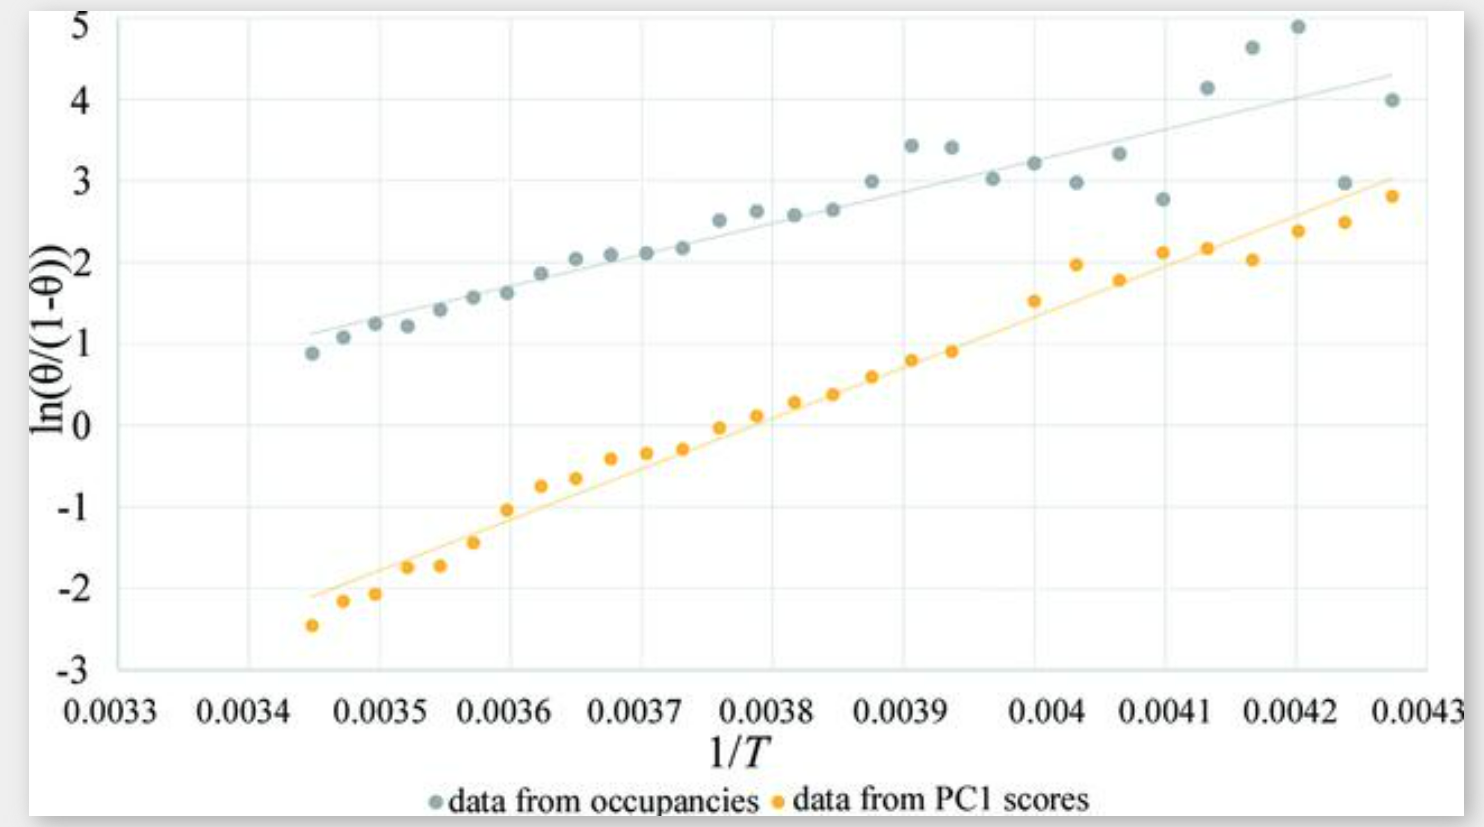
“Figure 5 Plot and linear regression of the linearized van ‘t Hoff equation. In the grey plot, θ is calculated as occCO2/occCO2max. y = 3842.6x − 12.123, R2 = 0.8486. In the yellow plot, θ is calculated as PC1/PC1max, using PC1 scores from the analysis of real data. y = 6212.3x − 23.52, R2 = 0.983.“