“This study examines the kinetics of pyrolysis and oxidation of hydrochars through thermal analysis. Thermogravimetric analysis (TGA) and differential scanning calorimetry (DSC) techniques were used to investigate the decomposition profiles and develop two distributed activation energy models (DAEM) of hydrochars derived from the hydrothermal carbonization of grape seeds produced at different temperatures (180, 220, and 250 °C). Data were collected at 1, 3, and 10 °C/min between 30 and 700 °C. TGA data highlighted a decomposition profile similar to that of the raw biomass for hydrochars obtained at 180 and 220 °C (with a clear distinction between oil, cellulosic, hemicellulosic, and lignin-like compounds), while presenting a more stable profile for the 250 °C hydrochar. DSC showed a certain exothermic behavior during pyrolysis of hydrochars, an aspect also investigated through thermodynamic simulations in Aspen Plus. Regarding the DAEM, according to a Gaussian model, the severity of the treatment slightly affects kinetic parameters, with average activation energies between 193 and 220 kJ/mol. Meanwhile, the Miura–Maki model highlights the distributions of the activation energy and the pre-exponential factor during the decomposition.”
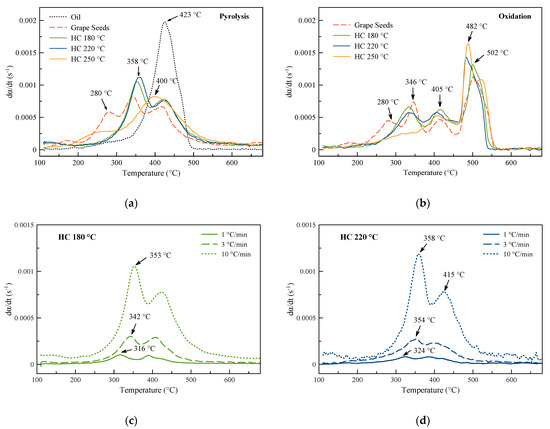
shows the derivative thermogravimetric curves (DTGA) of grape seeds and hydrochars under pyrolytic and oxidative conditions, at different heating rates. shows a sum of the position of local peaks, with their temperatures and intensities.
Overall, both grape seeds and hydrochars mostly decompose between 200 and 500 °C, indicating that most of the volatile matter is removed in this range. Grape seeds present three main decomposition peaks, occurring at 280, 343, and 421 °C under a pyrolytic atmosphere. These peaks can be attributed to the overlapped decomposition of hemicellulose, lignin plus cellulose, and oil, which are the main constituents of grape seeds (around 7% cellulose, 31% hemicellulose, 44% lignin, and 10–15% oil [
41,
42]). Indeed, it is well known that under pyrolytic conditions, due to its amorphous and little polymerized structure, hemicellulose is very reactive at low temperatures (in the range of 250–300 °C [
21,
43]). In the DTGA curves, this reactivity translates into the first decomposition peak. Meanwhile, the second peak can be attributed to the overlapped decomposition of lignin and cellulose, which both generally decompose in the 300–350 °C range [
43]. Considering the low content of cellulose (around 7% [
41,
42]), lignin clearly dominates at this temperature. Beyond this decomposition, lignin also contributes by forming a decomposition “baseline” to the profile, overlapping the other components. Indeed, due to its high polymerized structure and higher heterogeneity, it decomposes also (less intensively than at 300–350 °C) in a broad range of temperatures, from around 230° up to 600 °C [
43]. Therefore, during the pyrolysis of grape seeds, its decomposition could overlap to that of the other constituents, forming a “baseline” to the overall profile. Meanwhile, comparing the measured curve with that of grape seed oil from previous work by our group [
28], it is clear that the peak occurring at 423 °C can be attributed to the decomposition of the oil. Regarding the hydrochars, through HTC, grape seeds undergo carbonization, decreasing their atomic O/C and H/C ratios with a natural reduction of the volatile matter as the harshness of the process increases [
32]. In DTGA curves, this translates in flattening the first decomposition peak at around 280 °C, which is indeed absent for all the hydrochars. Therefore, the authors can affirm that hemicellulosic compounds are mostly degraded during HTC. Interestingly, the 250 °C hydrochar exhibits a broad and not intense decomposition between 200 and 300 °C. Since hemicellulose degrades during HTC, this reactivity can be explained by the presence of re-polymerized compounds from the aqueous phase. Indeed, during HTC, sugar-derived compounds dissolved in the aqueous phase (like 5-HMF) can undergo condensation and re-polymerization, forming a solid phase called “secondary char” [
44]. Beyond this, fatty acids formed during the hydrolysis of the oil could also be embedded in the solid phase, conferring to the sample an extra-reactivity at low temperatures. Both grape seeds and 180 and 220 °C hydrochars show their highest reactivity at around 350 °C, attributable to the degradation of lignin and cellulosic derived compounds. Differences can be due to both the heterogeneity of the feedstock and the synergistic behavior among the constituents, which are present in different ratios in the various samples. Conversely, the 250 °C hydrochar, after the initial slow decomposition at 200–300 °C, shows only one main decomposition peak at 400 °C. Therefore, while the 180 and 220 °C hydrochars tend to follow the feedstock profile (2nd and 3rd peaks), the 250 °C hydrochar highly deviates from that, highlighting the impact of the HTC operating temperature on the devolatilization profile. Overall, it is important to highlight to positive effect of the HTC treatment: after HTC, curves tend to shift towards the right region of the graph, demonstrating a higher thermal stability during the degradation process.