

https://doi.org/10.3390/foods11223705
”
2. ICP-MS: Understanding the Basic Principles
ICP-MS is a robust analytical technique for the determination of multi-elemental composition (qualitatively), concentration (quantitatively) and isotopic abundances of various matrices. Generally, an ICP-MS instrument consists of (i) a sample introduction system, (ii) an ion source (Inductively Coupled Plasma, ICP), (iii) the electrostatic lenses, (iv) an interface, (v) a mass spectrometer and (vi) a detector. Figure 2 depicts a typical schematic representation of the basic components of ICP-MS.
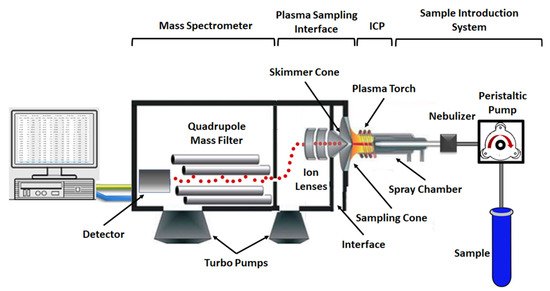
Figure 2. Schematic diagram of the main components of an ICP-MS (Figure adapted with permission and modified from Ref. [21]).
In food chemistry, prior to analysis, sample preparation procedure comprises various steps depending on material’s physical state which could include washing, lyophilization, crushing, extraction, and homogenization. In all cases a thermally-assisted digestion in acidic conditions (HNO3, HNO3/H2O2, HNO3/HCl, or HNO3/HF) is essential. According to the literature, samples are commonly digested with pure HNO3 (65–70%) on microwave oven, followed by dilution of the resulting solution with ultra-pure water [22]. It is an essential step of the analysis leading to the dissociation of sample’s matrix and the simultaneous release of the elements (analytes).
Due to the fact that initially the ICP-MS analysis was designed for liquids, samples are ordinarily pumped into a solution nebulizing system in liquid phase. Although, gases and solids are able to be inserted by using diverse introduction systems including chemical gas generation, electrothermal vaporization, high performance liquid chromatography (HPLC) or laser ablation [23]. In a typical arrangement, samples are placed into an autosampler and a peristaltic pump guides them to the nebulizer. Each sample is mixed with argon (Ar) gas creating an aerosol which enters to the spray chamber. The later extracts the large aerosol droplets, due to the inefficiency of the plasma to dissociates them, and subsequently normalizes the flow of the liquid coming from the peristaltic pumps [24,25]. Thereafter, the final fine aerosol traverses the main channel of the argon plasma. The high temperature plasma fosters the ionization of the sample by vaporizing, decomposing, atomizing and finally ionizing the droplets of the aerosol. It should be noted that the ionization potential and the temperature of the plasma define the degree of ionization of the elements [26]. Argon has much higher ionization potential than the majority of the elements, leading to their efficient ionization and creating singly charged positive ions. The generated positively charged ions are separated from the plasma into the interface region through the orifice (~1 mm) at the tip of the sample cone, which, in turn passes through the next orifice (~0.45 mm) of the skimmer cone. Between the two cones the interface pressure is constant at 150–300 Pa. Skimmer cone is the entrance of the high vacuum area (~77 × 10−5–1 × 10⁻³ Pa) where the ion lenses and the mass analyzer are located. The electrostatic lenses or ion optics focus and direct the ion beam toward the mass spectrometer, and simultaneously redirect unwanted species (i.e., non-ionized substances and photons) which are the main reason of background noise and signal instability when they are observed by the detector. The fundamental operation of the lenses depends on the manufacturer company of the ICP-MS instrument (i.e., Agilent, and Perkin Elmer). Following the procedure, the ion beam reaches the mass analyzer, the type of which is depended on the ICP-MS system. Generally, in food analysis, quadrupole or octupole type mass analyzer is used. The function of all mass analyzers is based on the determination of ion’s mass/charge (m/z) ratio, which is responsible for the division of ions in a sample [27,28]. At the end of mass analyzer, the positively charged ions, separated according to their m/z ratio, strike the detector, which is largely an electron multiplier (EM). The resulting culminated signal pulse is referred as ion ‘count’ (with units counts per second (CPS)) and corresponds to ions with specific m/z ratio. Due to this fact, ICP-MS is a highly sensitive analytical technique with detection limits being in ng/L for most of the elements.
As most analytical techniques, ICP-MS utilizes a calibration curve to convert the CPS signal to concentration. Calibration curves are constructed, for each element which is needed to be investigated, by measuring solutions of known concentrations. Figure 3 depicts an example of a calibration curve for calcium (44Ca) measured in different concentrations (2, 10, 50, 100, and 600 ppb). Moreover, in an attempt to correct variations in instrument’s sensitivity and/or matrix effects internal standardization (IS) technique is performed. One or more internal standard (IS) elements with similar masses and ionization potentials with the measured analytes are used in order to monitor the analyte-IS signal ratio [28,29,30]. When this ratio is relatively constant the (±20% referring to IS recovery, Figure 4) alterations in operational conditions and matrix effects are minimized, improving the sensitivity and precision of the ICP-MS analysis. Depending on the material which is analyzed other correction methods have been reported including matrix-mached calibration [31,32], method of standard additions [33] and isotope dilution [34,35].
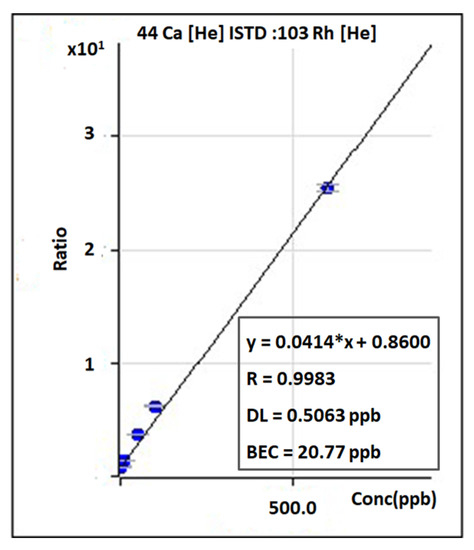
Figure 3. Example of a typical calibration standard curve (44Ca in helium mode ([He]) with Rh internal standard). y = 0.0414x + 0.8600: The output equation extracting after fitting the data to a linear regression, R: Standard Deviation, DL: Detection Limits, BEC: Background Equivalent Concentration. Units of Ratio between the signal of 44Ca and 103Rh (y-axis): counts per second (CPS).
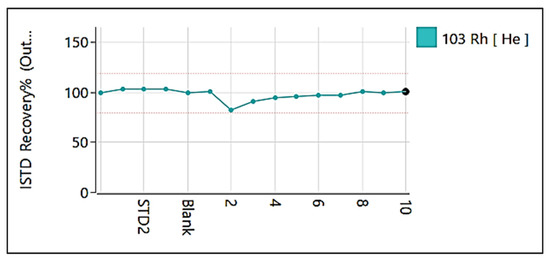
Figure 4. Plot of internal standard stability in an ICP-MS analysis of agri-food samples. Y-axis is referred to the percentage recovery of internal standard (Rh) solution.
Interferences in ICP-MS analysis are divided into two main categories: (a) spectroscopic, when atomic or molecular ions have equal m/z ratio as the analyte, and (b) non-spectroscopic, which occurred by sample matrix and/or instrument drift. Spectroscopic interferences are potentially a result of isobaric elements (i.e., 114Cd+ and 114Sn+), double charged (i.e., 88Sr2+ and 44Ca+), or polyatomic ions (i.e., 44CO2+ and 44Ca+), and/or tailing interferences due to overlapping of two adjacent peaks in the spectra. Table 1 lists a number of the most common spectroscopic interferences [28,36]. On the other hand, analytical errors may be occurred by the non-spectroscopic interferences. The latter arise from matrix effects or instrument drifts leading to suppression or enhancement of the signal. Malfunctions at introduction system (Sample Introduction Effects), ionization in the plasma (Plasma Effects), and electrostatic phenomena among the ions in the interface and ion lenses (Space-Charge Effects) constitute the origin of matrix effects. On top of that, gradually by the use of instrument salts dissolved in the aerosol deposit around cones. The fact that decreases the size of the orifice of the cones suppressing the analyte’s signal. In-depth study about ICP-MS interferences and various strategies to reduce or eliminate them can be found on the review article written by Wilschefski and Baxter, published in 2019 [28].
Table 1. Selected typical spectroscopic interferences.
| Isotope | Isobaric Interference |
| 40K | 40Ca |
| 50V | 50Cr |
| 64Ni | 64Zn |
| 94Zr | 94Mo |
| 113In | 113Cd |
| Isotope | Double Charge Ion |
| 44Ca | 88Sr2+ |
| 69Ga | 138Ba2+ |
| 70Ge | 140Ce2+ |
| 85Rb | 170Er2+ |
| 119Sn | 238U2+ |
| Isotope | Polyatomic Ions |
| 28Si | 14N2+, 12C16O+ |
| 31P | 14N16O1H+ |
| 44Ca | 12C16O2+ |
| 36Fe | 40Ar16O+ |
| 75As | 40Ar35Cl+ |
According to the literature various methods of data analysis are used for building analytical models in order to accurately determine the geographical origins of the samples based on the concentrations of measured analytes. Principal component analysis (PCA), Cluster analysis (CA), Linear Discriminant Analysis (LDA), and Canonical Discriminant Analysis (CDA) consist the most common analytical models [5].
3. Database and Literature Search
Two online databases, Web of Science (Clarivate) and Scopus (Elsevier), were used for the literature searching. The terms were used, initially, on each of the above databases, are the following: ICP-MS AND authentication origin, ICP-MS AND geographical origin, ICP-MS AND geographical fingerprints, ICP-MS AND protected geographical indication, ICP-MS AND protected designation of origin, ICP-MS AND traceability, ICP-MS AND geographical origin AND agricultural products, ICP-MS AND geographical origin AND foods, ICP-MS AND protected geographical indication AND agricultural products, ICP-MS AND protected geographical indication AND foods, ICP-MS AND protected designation of origin AND agricultural products, ICP-MS AND protected designation of origin AND foods, ICP-MS AND traceability AND agricultural products, and ICP-MS AND traceability AND foods. As a second step, the type of each individual product (X), resulting from the initial literature investigation, was added as a term as follows: ICP-MS AND authentication origin AND (X), ICP-MS AND geographical origin AND (X), ICP-MS AND geographical fingerprints AND (X), ICP-MS AND protected geographical indication AND (X), ICP-MS AND protected designation of origin AND (X), ICP-MS AND traceability AND (X). All the included records are screened to be relevant to our topic of study, which includes the employment of ICP-MS analysis for the geographical origin authentication of agricultural products and foods. Moreover, Zotero software was used to prepare the references and simultaneously to avoid duplicated publications. The final 173 articles were classified according to the food group investigated for the geographical discrimination with the use of ICP-MS technique (Figure 5).
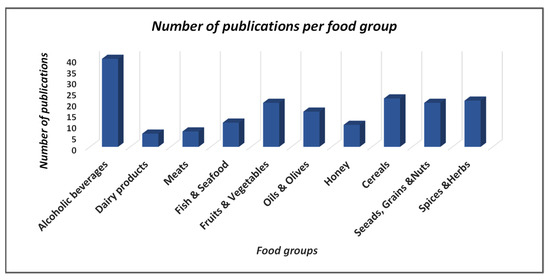
Figure 5. Diagrammatic representation of the number of publications with regards to the type of product.
“