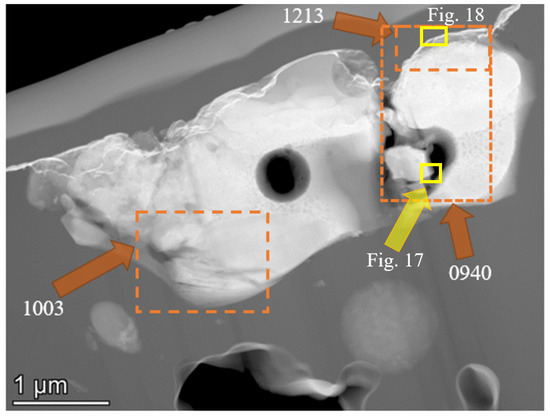
Several REE-rich areas were examined in the particle shown on . It is emphasized that, along with the particle shown on , this is not a common find in this fly ash. The particle was selected following the preliminary SEM-EDS examination based on the promise of a diverse assemblage of REE-rich areas.
Figure 9. Areas 0940, 1213, and 1003 within a Y- and REE-rich fly ash particle. 1213 is within 940. The locations of Figures 17 and 18 are shown. HAADF (high-angle annular dark-field) image.
Areas 1213, 0940, and 1158/1201
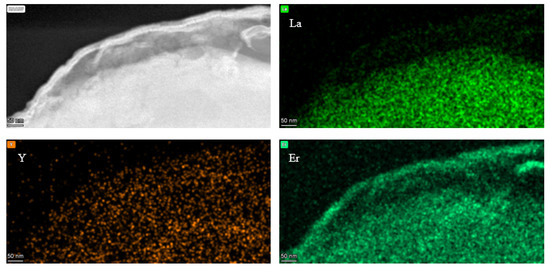
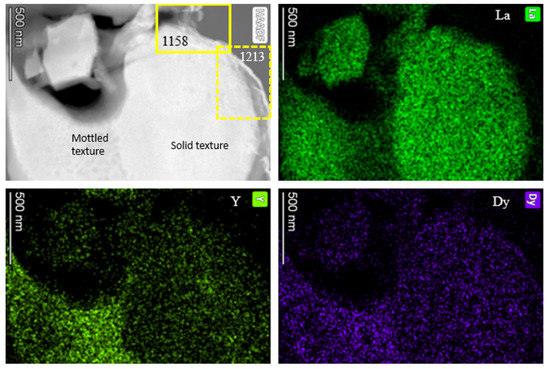
Area 1213 is part of a larger area dominated by light REE but with some heavy REE and Y contributions (). The high-angle annular dark-field (HAADF) image along with selected element maps is shown on . In this example, La serves as a proxy for Ce and the other light REE and Er, along with Y, is a proxy for the heavy REE. The 0- to 10,000-eV range and the 4000- to 7500-eV REE range for area 1 within area 1213 is shown on . In this case, the light REE and Gd show significant concentrations. Area 2, towards the upper edge of the particle (HAADF image on ), did not have significant concentrations of the REE.
Figure 10. Area 1213. Clockwise from upper left: HAADF image; La element map; Er element map; and Y element map.
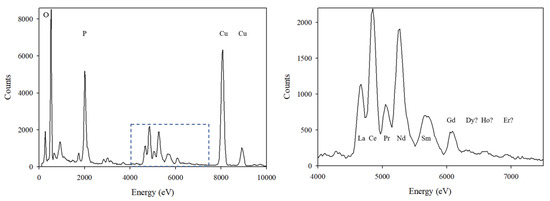
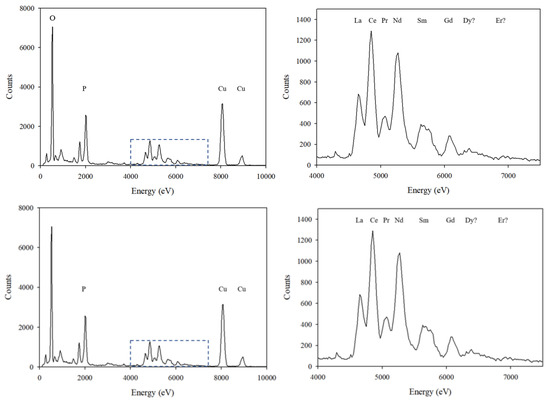
Figure 11. EDS for area 1 within area 1213. The full counts for the 0 to 10,000 eV range are shown on the (left) and a restricted count range for the 4000–7500 eV range is shown on (right) (dashed box on full-range figure indicates the area of the right figure). The Dy, Ho, and Er “peaks” do not represent significant concentrations of those elements. The Cu peak belongs to the grid holder, not the sample.
Area 0940, the larger area including and adjacent to area 1213 (inset on HAADF image), is generally dominated by light REE, represented by La, with lesser concentrations of Y and heavy REE, the latter represented by Dy (). Yttrium and Dy are less dense in the truncated oval La-rich area on the right side, the rectangular particle in the upper-left quadrant, and in the lower left corner of . Yttrium and, to a lesser degree, Dy and the other heavy REE, show their most evident concentrations in the region between the higher La concentrations (right side of the lower-left quadrant). On the HAADF image, the latter region shows up as a mottled area, a notably different texture compared to the flanking brighter areas. The mottling might represent few-nm crystals dispersed in the region or it could also be FIB re-deposition or FIB-induced damage, along with small crystallites present. The 0- to 10,000-eV range and the 4000- to 7500-eV REE range for area 3 within area 0940 is shown on . Areas 1 and 2 have similar EDS spectra to , but their Dy and Er “peaks” are even less significant than the peaks.
Figure 12. Area 0940. Clockwise from upper left: HAADF image of area with insets of areas 1213 () and 1158 (); La element map; Dy element map; and Y element map.
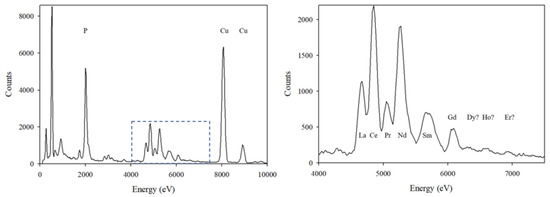
Figure 13. EDS for area 3 within area 0940. The full counts for the 0 to 10,000 eV range are shown on the left and a restricted count range for the 4000–7500 eV range is shown on right (dashed box on full-range figure indicates the area of the right figure). The Dy and Er “peaks” do not represent significant concentrations of those elements. The Cu peak belongs to the grid holder, not the sample.
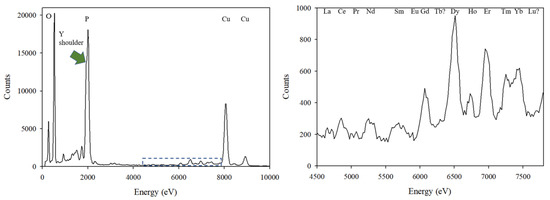
Figure 16. EDS for area 1 within area 1003. The full counts for the 0 to 10,000 eV range are shown on the left and a restricted count range for the 4500–7800 eV range is shown on right (dashed box on full-range figure indicates the area of the right figure). Yttrium appears as a shoulder on the P peak. The “peaks” for Eu, Tb, and Lu are not considered to be significant. The Cu peak belongs to the grid holder, not the sample.
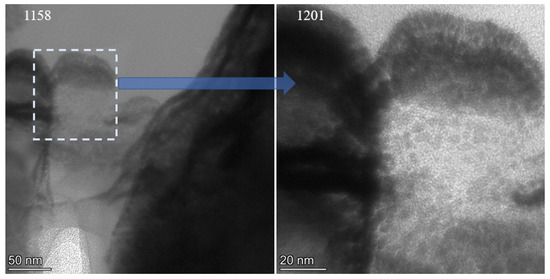
Area 1158 with magnified area 1201 (1158 inset on ) consists of a mottled region capped by whisker-like fine crystals ().
Figure 14. Area 1158 with inset shown for area 1201 (right).
Area 1003
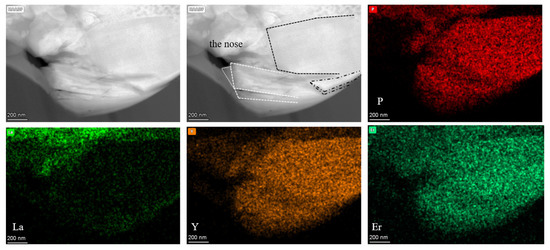
The lower-left corner of the particle shown on contains at least three crystals of a P-Y-HREE-rich mineral (). EDS () indicates that the mineral is a REE-rich mineral, possibly xenotime. The EDS spectra is unique in this study in showing significant concentrations of all of the even-number REE along with significant concentrations of most of the heavy REE. The exceptions to the latter trend are the insignificant concentrations of Tb and Lu. While Y has an apparent presence on the element map (), the proximity of the Y Lα and Lβ (1.924 and 1.998 keV, respectively) to the P Kα (2.010 keV) means that Y overlaps with P and can only be seen as a shoulder on the low-eV side of the P Kα. For all of the P-rich minerals in this study (xenotime and monazite are possible minerals, but not definitively identified), caution must be applied in interpreting, and not over-interpreting, apparent shows of Y (or any other element). The P- and LREE-rich (with La serving as the proxy for the light REE) “nose” above the latter crystals could not be specifically identified, but, from the chemistry, it would appear to be a LREE phosphate.
Figure 15. Area 1003. Clockwise from upper left: HAADF image of area; HAADF image with xenotime crystals outlined; P element map; Er element map; Y element map; La element map.