2.5. Optical Setup
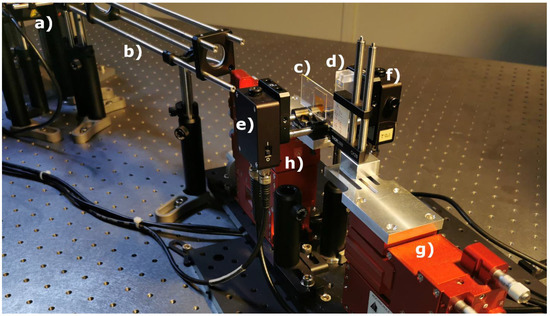
and outline the optical pump setup and emission measurement setup of the organic DFB laser in our laboratory. With a cuvette being placed between the organic laser and the bottom emission detection (d)), we also used this setup as our organic laser absorption spectrometer. Sketched in blue is the UV pump radiation required to optically pump the organic DFB laser. The pump pulse of a frequency tripled passively Q-switched ND:YAG laser (FTSS355-Q2; CryLas, Berlin, Germany) with a wavelength of λpump=355 nm�����=355 nm exhibits a pulse duration of 1.9 ns1.9 ns. All measurements are carried out at a pump pulse repetition rate of 1 Hz1 Hz. The use of neutral density (ND) filters as a variable ND filter mounted on a stage combined with a revolver equipped with discrete ND filters allows variation of the pump energy. A beam splitter (92:8) was positioned in the pump beam behind the ND filters for pump pulse energy monitoring. Pump energy calibration of the monitor photodiode was performed using an energy sensor (Pe10b; Gentec, Quebec, QC, Canada). A focusing unit consisting of a collimator and two plano-convex lenses was used to create an elliptical pump spot with variable beam diameter in length (ωy=180 μm��=180 �m to 1500 μm1500 �m) and fixed diameter in width (ωx=150 μm��=150 �m). The organic DFB laser was arranged at an angle (α=82∘�=82°) in the pump beam. The oblique pump configuration at a steep angle allows the measurement of organic laser emission at small distances without affecting the pump radiation. In addition, the steep angle prevents the sample fluid from being exposed to the UV pump source. The actual pump spot on the surface of the organic laser thus also exhibited an elliptical shape but with transformed dimensions (ωy=1497 μm��=1497 �m, ωx=1078 μm��=1078 �m), with the longer beam waist oriented orthogonally to the grating lines of the DFB resonator. The organic DFB laser emission in both directions is outlined in red in . The detection of the emission of the organic DFB laser as well as the monitoring of the pump emission was done with amplified Si Photodetectors (PDA10A; fixed gain; Thorlabs, Newton, MA, USA). In order to calibrate the pump energy monitor diode, the organic DFB laser was removed from the setup and an energy sensor was used instead. The photodetectors were read out with an oscilloscope (MSO9254A; Agilent, Santa Clara, CA, USA). To avoid discrepancies in bottom and top emission detection, nominally identical photodiodes and connectors were used.
Figure 3. Schematic of the optical pump setup (with focus unit) and the emission measurement setup of an organic DFB laser with two different measurement channels (top emission and bottom emission).
Figure 4. Image of the optical emission measurement setup; (a) pump laser, filter and monitoring, (b) focus unit, (c) organic DFB laser, (d) cuvette, (e) photodetector top emission, (f) photodetector bottom emission, (g) translation stage organic DFB laser, (h) translation stage laser detection unit.
As mentioned above, we used an organic DFB laser as emission source for absorption spectroscopy. A DFB resonator generates feedback based on a periodically distributed change of the refractive index and the optical gain. Resonance for the guided mode is enabled in close vicinity of the Bragg wavelength (λBragg������) given by the Bragg condition [14,28].
where Λ� is the period of the spatial modulation, neff(λ)����(�) is the effective refractive index of the guided mode, and N� is the order of diffraction. Thus, the Bragg condition describes the wavelength-selective resonance based on the diffraction of a guided mode at a periodically changing interface [29]. A change in lasing wavelength can be achieved by changes in periodicity [21,30,31] or guidance of the mode. One common way to change the guiding of the mode is to vary the thickness of the core layer of the planar waveguide [14,32,33]. The laser emission wavelength can thus be varied through changing the thickness of the organic layer that forms the core layer of the waveguide.
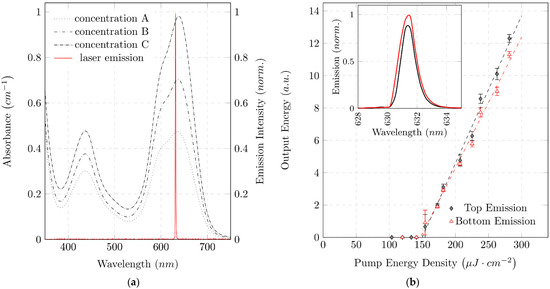
Variation of the emission wavelength offers the possibility to optimize the laser to the color forming reaction for measuring a specific analyte. a plots the absorbance of MG+P in the visible spectrum for three different phosphate concentrations. In the visible spectrum, MG+P shows two dominant absorption peaks. The two peaks λ1=439 nm�1=439 nm and λ2=634 nm�2=634 nm, mark possible measurement wavelengths. Both absorption peaks could potentially be used to determine the phosphate concentration. Our absorbance measurements were performed at λ2=634 nm�2=634 nm because this peak offers the highest measurement sensitivity. Our organic laser was designed for an emission wavelength close to the absorption maximum λ2=634 nm�2=634 nm. The resulting emission spectrum of the organic laser with a peak wavelength of λLas=631 nm����=631 nm is shown in a.
Figure 5. Laser emission characteristics and spectral absorption of colorimetric reaction: (a) Absorbance spectra of MG+P for different phosphate concentrations measured with a UV-VIS spectrometer. Concentrations: A=0.5 mg/LA=0.5 mg/L; B=1 mg/LB=1 mg/L; C=2 mg/LC=2 mg/L. Additionally, a normalized organic laser emission spectrum is shown. The emission wavelength of the laser defines the measurement wavelength and is thus optimized for a local absorption maximum of MG+P. Absorbance of MG+P shows a significant dependence on the phosphate concentration in the vicinity of the measuring wavelength; (b) Emission characteristics of a fabricated organic DFB laser for both top and bottom emission: optical output pulse energy versus optical pump energy density and emission spectra (inset). Almost identical laser threshold energy density of about 150 μJ⋅cm−2150 �J⋅cm−2 in top and bottom emission direction is observed.
Optical alignment is performed with two five-axis translation stages (i5000; Luminos, Ottawa, Canada). The organic DFB laser is mounted on one stage (g) and the detection instruments for recording the top and bottom organic laser emission on another (h). In order to record both the optical spectrum and the intensity, the detection unit is mounted in a cage system (SR 30mm; Thorlabs, Newton, USA) on the translation stage. The fibers of the fiber-coupled spectrometer can easily be replaced by photodiodes without change in alignment. Furthermore, the detection units for top and bottom emission are mechanically connected to each other and can be moved symmetrically around the organic DFB laser. The emission spectrum was used as orientation for the alignment of the optical measuring equipment. The shift of spectral emission as a function of divergence angle of the organic DFB laser must be taken into account when aligning the measuring equipment [
34]. Using two multimode fibers (
d=600 μm�=600 �m) and a spectrometer, the fibers fixed to each other are aligned to the pump spot. Using rotational alignment of the fibers around the pump spot, fine tuning in the adjustment of the spectral emission is achieved. The inset in b shows emission spectra in top and bottom direction, measured with a spectrometer (USB 2000; Ocean Optics, Orlando, FL, USA). The emission spectra in the different emission directions show hardly any spectral differences. The peak wavelengths are
λBottom=631.42 nm�������=631.42 nm and
λTop=631.38 nm����=631.38 nm, and the spectral bandwidths are
ΔλFWHM−Bottom=1.325 nmΔ�FWHM−Bottom=1.325 nm and
ΔλFWHM−Top=1.115 nmΔ�FWHM−Top=1.115 nm. The emission in the top direction is approximately
0.830.83 times smaller than the bottom emission. To avoid spectral differences due to measurement set up, both spectra were measured with the same spectrometer. Therefore, the spectrum of the pulsed laser was measured in each emission direction one after the other. The emissions in top and bottom direction are, thus, not associated with the same pump pulse. Any deviation in the pump pulse causes deviations in emission intensity. Both measurement fibers showed no discernible deviation in alignment to the surface normal of the organic laser. Fibers were positioned at a distance of
25 mm25 mm to the laser.
Examination of the laser characteristics is a common option to prove laser activity [
35]. Thus, the optical output energy is plotted in b for different pump energies. Laser action occurs above the laser threshold, where the slope efficiency is dramatically increased by the transition from spontaneous emission to stimulated emission. The threshold is reached at the same pump energy density for top (
DTop=149.90 μJ⋅cm−2±12.3 μJ⋅cm−2����=149.90 �J⋅cm−2±12.3 �J⋅cm−2) and bottom (
DBottom=147.14 μJ⋅cm−2±15.6 μJ⋅cm−2�������=147.14 �J⋅cm−2±15.6 �J⋅cm−2) emissions. The emission ratio of the organic DFB laser in top and bottom emissions appears to differ during measurement of the laser characteristics (laser output energy as a function of pump energy). The ratio of the slope efficiencies of top and bottom emissions is 0.88 ± 0.035, which deviates slightly from the theoretical prediction of 1 [
24]. In order to achieve different pump energy densities, the optical power of the pump pulse must be varied. This energy variation is done by mechanical ND filters. It is assumed that small mechanical interventions in the pump beam guidance, which occur by mechanically shifting the ND filters, lead to a local change of the pump spot. The local change in pump position on the organic laser could lead to a discrepancy in measurement acquisition. The photodiodes aligned in advance with the pump position then no longer measure in the center of the organic DFB laser beam. Measurements carried out after realigning the diodes gave an emission ratio of 1, as predicted by Streifer et al. [
24].