

https://doi.org/10.3390/toxins14070454
”
2.1. Method Principle
In this study, by exploiting the specificity of immunomagnetic beads and the signal amplification effect of QDs, an automatic platform for enrichment, purification, labeling, and digestion was constructed to detect AFB1 through AAS. This principle is outlined in Figure 1. AFB1 in the sample extract was first specifically captured by IMBs according to the antigen–antibody reaction. After the reaction, the IMBs were transferred to wash wells to prevent nonspecific adsorption of the matrix from affecting subsequent steps and to improve the stability of the method. The complex of AFB1 and the IMBs was then transferred to a reaction well, where the bovine serum albumin (BSA)-assisted QD-labeled intact AFB1 antigen (AFB1-BSA-QD) is located, and AFB1-BSA-QD occupied the remaining adsorption sites. After washing, the IMB complexes were transferred to digestion well, and the QDs captured on the IMB were digested by the acid solution, releasing the corresponding metal ions (Cd2+). When the content of AFB1 in solution is high, a low amount of the AFB1-BSA-QD conjugate should be bound to the IMB, and low content of Cd2+ must be released via digestion. Therefore, the content of Cd2+ in the digestion solution is inversely proportional to the content of AFB1. Finally, the released Cd2+ was measured using an atomic absorption spectrometer to detect AFB1.
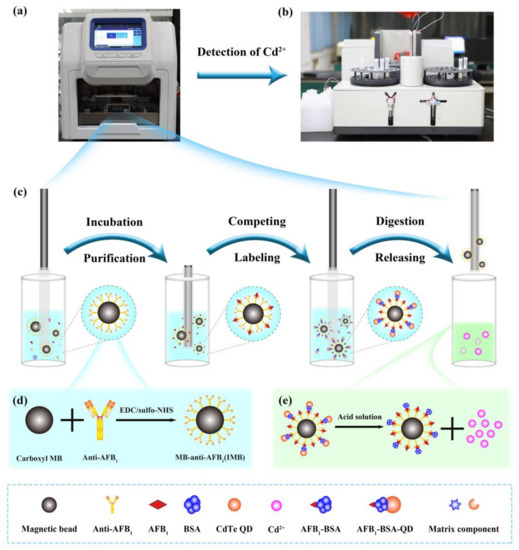
Figure 1. Schematic diagrams of the integrated detection platform: (a) automatic purifier; (b) atomic absorption spectrometer; (c) the purification process of the automatic purifier; (d) synthesis of immunomagnetic beads (IMB); (e) release of Cd2+ from quantum dot digestion.
2.2. Optimization of Experimental Parameters
2.2.1. Extraction Solution
Adequate extraction of the target from the sample matrix is the first step toward realizing accurate detection. In this experiment, blank rice was spiked with AFB1 at a known concentration and different proportions of methanol and acetonitrile (30–80% methanol in water and 30–84% acetonitrile in water) were used to investigate the extraction efficiencies of AFB1. The detection results were compared using the least significant difference method; the results are shown in Figure 2A. When 50% and 84% acetonitrile in water were used as the extract, the recovery rate of AFB1 was close to 100%, and there was no significant difference between the two. To reduce the use of organic solvents, 50% acetonitrile in water was selected as the optimal extraction solution for AFB1.
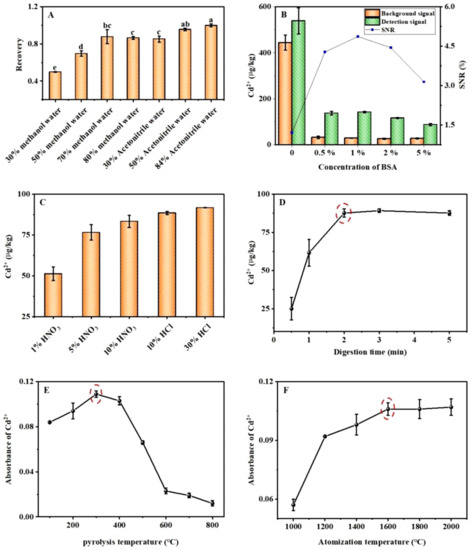
Figure 2. Optimization results of (A) extraction solution (the same small letters indicate no significant difference, p > 0.05), (B) BSA concentration, (C) digestion solution, (D) digestion time, (E) pyrolysis temperature, and (F) atomization temperature. The red circles mark the best conditions.
2.2.2. Nonspecific Adsorption
Nonspecific adsorption in the sample matrix leads to strong background interference. To eliminate background interference, BSA was used to block the inactive sites; however, the BSA concentration was too high, which negatively affected the strong binding. Therefore, the concentration of BSA in the reaction system was optimized; the results are shown in Figure 2B. As the BSA concentration increased from 0% to 5%, the signal-to-noise ratio of Cd2+ first increased and then decreased; when the BSA concentration was 1%, the signal-to-noise ratio of Cd2+ reached the maximum value. Therefore, 1% was determined to be the optimal BSA concentration.
2.2.3. Digestion Conditions
The digestion effect of acid on the QDs directly affects the generation of Cd2+. To maximize the digestion of the QDs and generate Cd2+ in the shortest amount of time, the digestion solution and time were optimized. Figure 2C shows that as the concentration of HNO3 solution increased from 1% to 10%, the concentration of Cd2+ trended upward, whereas as the concentration of the HCl solution increased from 10% to 30%, the concentration of Cd2+ exhibited only a slight upward trend. Therefore, 10% HCl was determined to be the optimal digestion solution. The digestion time was optimized by using an optimal digestion solution. As shown in Figure 2D, with the extension of the digestion time, the concentration of Cd2+ gradually increased, reaching a maximum at 2 min, and then gradually stabilized. Therefore, 2 min was determined as the optimal digestion time.
2.2.4. Atomic Absorption Conditions
Pyrolysis is a crucial stage in sample pretreatment. To ensure that the measured elements are not lost, an appropriate pyrolysis temperature at which matrix interference and pyrolysis time are reduced must be chosen. As shown in Figure 2E, with an increase in the pyrolysis temperature, the absorbance value of Cd2+ first increased and then decreased, reaching a maximum of 300 °C. This is because an appropriate increase in the pyrolysis temperature can allow the removal of the coexisting matrix and interfering components, the reduction or elimination of the background peak, and an increase in the absorbance value. When the temperature increased beyond a certain level, the pyrolysis-induced loss of Cd2+ increased, resulting in a decrease in the absorbance value. Therefore, 300 °C was determined to be the optimal pyrolysis temperature.
The atomization temperature is determined on the basis of the properties of the elements and their corresponding compounds. If the temperature is too high, the sensitivity is reduced, and the service life of the graphite tube is shortened. A low atomization temperature can prolong the service life of the graphite tube. However, if the atomization temperature is too low, the complete atomization of the measured element cannot be guaranteed, resulting in decreased sensitivity and low reproducibility. As shown in Figure 2F, with an increase in the atomization temperature, the absorbance of Cd2+ gradually increased, reached a maximum at 1600 °C, and then gradually became stable. Therefore, 1600 °C was determined to be the optimal atomization temperature.
2.3. Establishment and Specificity of Standard Curves in a Standard Solution and Four Types of Matrix Fluids
Under optimal conditions, taking the log value of the AFB1 concentration as the abscissa and the Cd2+ concentration as the ordinate, the S-shaped curve and standard curve of the spiked standard solution and the four matrix solutions can be obtained. The results for the spiked standard solutions are shown in Figure 3A. The correlation coefficient of the fitted curve was 0.9986, and when the concentration of AFB1 was 5–240 μg/kg, the log value of its concentration was linearly related to the concentration of Cd2+ with an R2 of 0.9859. The limits of detection and quantification were 0.04 and 0.12 μg/kg, respectively. The standard addition results of the sample matrix (wheat, corn, peanut oil, and husked rice) are shown in Figure 3B–E, and the correlation coefficients of the curve fits were all greater than 0.99, approximately 1. In addition, the log value of the AFB1 concentration was linearly related to the concentration of Cd2+ within a certain range. The relevant parameters are listed in Table 1.
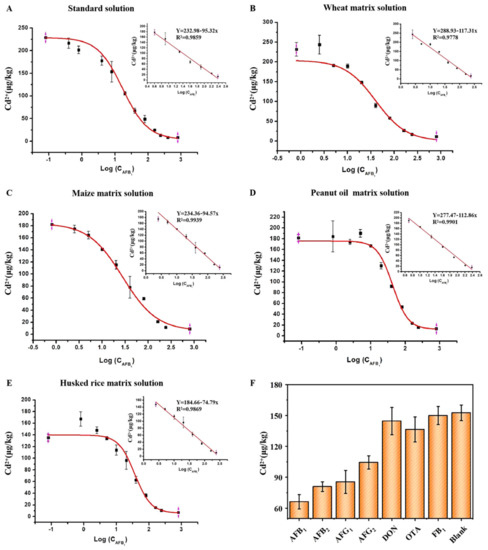
Figure 3. S-curves and standard curves of (A) a standard solution and (B–E) four matrix solutions spiked with aflatoxin B1 (AFB1). (F) Specificity detection results.
Table 1. Analysis parameters related to the sigmoid curves and standard curves of the standard solution and the four matrix solutions.
| Curve Range (μg/kg) | Curve Coefficient | Linear Range (μg/kg) | Linear Coefficient | |
|---|---|---|---|---|
| Standard solution | 0.08–800 | 0.9986 | 5–240 | 0.9859 |
| Wheat | 0.8–800 | 0.9944 | 2.5–240 | 0.9778 |
| Maize | 0.8–800 | 0.9951 | 2.5–240 | 0.9939 |
| Peanut oil | 0.08–800 | 0.9977 | 2.5–240 | 0.9901 |
| Husked rice | 0.08–800 | 0.9989 | 5–240 | 0.9869 |
To evaluate the selectivity of the detection platform for AFB1, three analogs of AFB1, including aflatoxin B2 (AFB2), aflatoxin G1 (AFG1), and aflatoxin G2 (AFG2), and common mycotoxins deoxynivalenol (DON) ochratoxin (OTA)and fumonisin B1 (FB1) were investigated. All toxin concentrations were 20 μg/kg. Figure 3F shows that AFB1 produced a significantly lower metal ion signal than that of the blank control, while the signal variations induced by the DON, OTA, and FB1 could be ignored. Although the metal ion signal values of the three analogs similar in structure to AFB1 are slightly lower, in the future, the use of antibodies with better specificity can reduce the cross-reactivity to AFB1 structural analogs and improve the specificity of the method.
2.4. Accuracy, Repeatability, and Reproducibility of the AAS Method
To evaluate the accuracy, repeatability, and reproducibility of the AAS method, four samples of corn, wheat, husked rice, and peanut oil were used, and they were spiked with three concentration gradients of low, medium, and high matrices (10, 20, and 40 μg/kg for maize and peanut oil; 2.5, 5, and 10 μg/kg for wheat; and 5, 10, and 20 μg/kg for husked rice). The recovery rates and intra- and inter-day relative standard deviations were measured and calculated; the results are shown in Table 2. The recoveries for the four matrices ranged from 92.6% to 108.7%, with intra- and inter-day standard deviations of 0.7–6.3% and 0.6–6.9%, respectively. These data demonstrate that the proposed method has high accuracy and precision.
”
Table 2. Recoveries and intra- and inter-day relative standard deviations of the sample matrices.
| Matrix | Recovery ± RSD (%, n = 3) | Inter-Day RSD (%) | ||
|---|---|---|---|---|
| Low | Medium | High | ||
| Maize | 99.5 ± 4.2 | 94.9 ± 3.2 | 101.7 ± 1.7 | 6.2 |
| Wheat | 92.9 ± 4.7 | 103.8 ± 2 | 100.3 ± 4.4 | 5.8 |
| Husked rice | 94.7 ± 5.2 | 95.8 ± 0.8 | 92.6 ± 4.8 | 0.6 |
| Peanut oil | 108.7 ± 6.3 | 104.4 ± 1.8 | 101.9 ± 0.7 | 6.9 |
The accuracy of this method was also verified using (certified) reference material. In this study, three AFB1 reference materials (maize, peanut oil, and husked rice) provided by ASAG were selected. Among them, the uncertainty range of maize (GBW(E)100386) is 24–30 μg/kg; the uncertainty range of peanut oil(JTZK-002) is 13.9–17.7 μg/kg; the uncertainty range of husked rice(JTZK-007) is 22.1–29.9 μg/kg. It can be seen from Table 3 that all the detected values of the AFB1 standard material are within the uncertainty range.
Table 3. The detection results for the certified reference material and reference materials (n = 3).
| AFB1 Reference Material | Lot Number | Detected Amount (µg/kg) | Certificate Value (µg/kg) ± SD |
|---|---|---|---|
| Maize | GBW(E)100386 | 26.5 | 27 ± 3 |
| Peanut oil | JTZK-007 | 15.2 | 15.8 ± 1.9 |
| Husked rice | JTZK-002 | 25.5 | 26 ± 3.9 |