

https://doi.org/10.1038/s41598-022-22204-1
“Membranous nephropathy is the main cause of nephrotic syndrome, which has an insidious onset and may progress to end-stage renal disease with a high mortality rate, such as renal failure and uremia. At present, the diagnosis of membranous nephropathy mainly relies on the clinical manifestations of patients and pathological examination of kidney biopsy, which are expensive, time-consuming, and have certain chance and other disadvantages. Therefore, there is an urgent need to find a rapid, accurate and non-invasive diagnostic technique for the diagnosis of membranous nephropathy. In this study, Raman spectra of serum and urine were combined with deep learning methods to diagnose membranous nephropathy. After baseline correction and smoothing of the data, Gaussian white noise of different decibels was added to the training set for data amplification, and the amplified data were imported into ResNet, AlexNet and GoogleNet models to obtain the evaluation results of the models for membranous nephropathy. The experimental results showed that the three deep learning models achieved an accuracy of 1 for the classification of serum data of patients with membranous nephropathy and control group, and the discrimination of urine data was above 0.85, among which AlexNet was the best classification model for both samples. The above experimental results illustrate the great potential of serum- and urine-based Raman spectroscopy combined with deep learning methods for rapid and accurate identification of patients with membranous nephropathy.”
”
Raman spectral data acquisition
A 15-μL drop of serum was removed onto aluminum foil using a pipette, dried at room temperature and then its Raman signal was measured directly. A high-resolution confocal Raman spectrometer (LabRAM HR Evolution, gora Raman spectroscopy, ideaoptics, China) with a YAG laser at excitation wavelength of 785 nm, an objective lens of 10 × , an integration time of 15 s, and a laser power of 160 mW was used to set the acquisition method to continuous acquisition. The Raman spectra of serum samples in the range of 500–2000 cm-1 were measured, and three spectral signals were recorded from different positions of each sample. A total of 35 × 3 urine data were obtained from MN patients and 38 × 3 from healthy controls; 43 × 3 serum data were obtained from MN patients and 32 × 3 from healthy controls. Since the differences between the three data from the same sample were small, the data were averaged for the three data from the same sample and then trained for data amplification and classification.
”
”
Data pre-processing
As shown in Fig. 1, there is no obvious Raman absorption peak in the range of 2000–4000 cm−1, so the serum and urine Raman spectra in the range of 500–2000 cm−1 were used in this experiment for biomedical research. Since the raw serum Raman spectra collected by the spectrometer contained noise and fluorescence background, in order to extract the Raman signal accurately and obtain more effective information, the airPLS method was used to perform baseline calibration of the serum and urine Raman spectral data in this paper. After baseline calibration of the raw data, origin 2018(http://www.winwin7.com/soft/51322.html) software was used to smooth the serum sample data using polynomial (Savitzky-Golay) with 20 smoothing points, and MATLAB R2021a(https://ww2.mathworks.cn/products/matlab.html) was used to smoothen the urine sample data with a smoothing window of 9. The average spectra of the two sample data after baseline calibration and smoothing are shown in Fig. 1. The urine and serum samples were divided into training and test sets according to diseased and healthy as 7:3, respectively, and then Gaussian white noise was added to the training set for data augmentation.
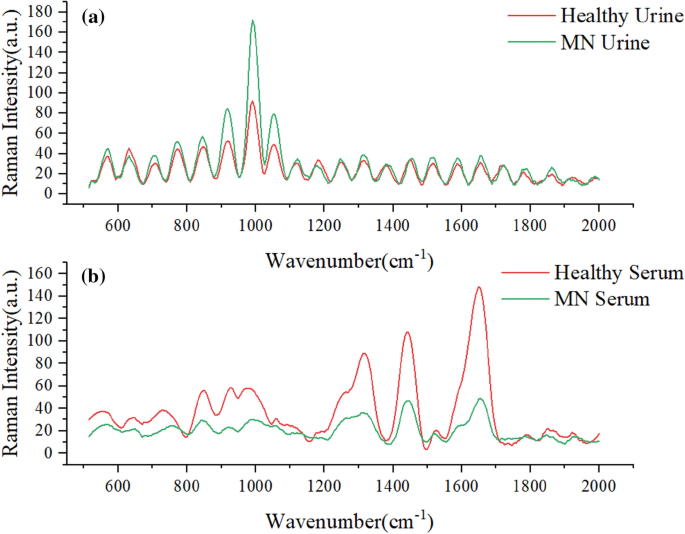
(a) Average spectra of urine and healthy samples from MN patients (b) Average spectra of serum and healthy samples from MN patients.
Data enhancement and cross-validation
The training effect of deep learning models improves with the increase of sample size in a certain range, and the large sample size can prevent the occurrence of overfitting and improve the generalization ability of the model to a certain extent. By comparing the existing data control augmentation methods, this study selects the Gaussian white noise data augmentation method to expand the data set. The pre-processed data were divided into training and test sets, and the sample size was expanded to five times the original size by adding five different decibels of Gaussian white noise of 16, 20, 24, 28 and 32 dBW to the training set44,45,46,47.
In order to evaluate the prediction performance of the model, reduce overfitting and obtain as much valid information as possible from the limited data, the model is validated using the five-fold cross-validation method. This method has the advantage of not requiring additional data splitting, which reduces the computational cost while avoiding data waste.
Spectral analysis
Figure 2a shows the absorbance of the six peaks with large differences in the serum spectrum, with large peak differences at 728, 842, 980, 1316, 1439 and 1650 cm−1; Fig. 2b shows the absorbance of the six peaks with large differences in the urine Raman spectrum, with large peak differences at 630, 918, 980, 1051, 1316 and 1657 cm−1. There are large peak differences, especially at 918, 980 and 1051 cm−1. These peak differences represent biomolecular differences between patients and control subjects in vivo and can be used as a theoretical basis for disease classification.
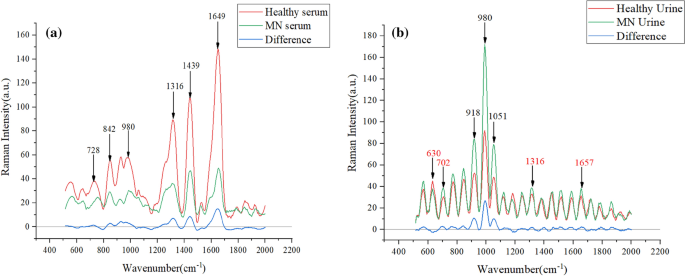
(a) Average spectra of serum and control group in membranous nephropathy (b) Average spectra of urine and control group in membranous nephropathy.
In Table 2, the Raman shifts corresponding to the characteristic peaks and their attribution information are listed48,49. Combined with Table 2, the glycerol content in the urine of patients with membranous nephropathy is slightly higher. 728 cm−1 represents C–C stretch and proline, 842 cm−1 represents glucose, 918 cm−1 represents proline, strong proline and glycogen, 980 cm−1 is protein, 1051 cm-1 is lipid, 1316 cm−1 is guanine, 1439 cm−1 indicates a bent deformation of CH2 cm-1, three amides at 1650 cm−1. The difference in these levels indicates a change in the composition of substances in the serum and urine of patients with membranous nephropathy, resulting in fewer amino acids, guanines, and proteins in patients than in normal subjects50.
Membranous nephropathy (MN) is a common cause of nephrotic syndrome in adults, and patients usually present with severe hypoproteinemia, which was concluded in the pathogenesis analysis51, so that the protein content becomes low in serum samples. Hypoxanthine–guanine phosphoribosyltransferase converts guanine to guanosine 5′ monophosphate in order to remedy normal purines when renal function is impaired52. Therefore, a decrease in serum guanine levels can occur. In addition, supplementation with amino acids such as proline is effective in patients with kidney disease, which may be related to the reduced amino acid levels in the patient53.
In the urine spectrogram, the biomarker corresponding to the position of the largest difference in the Raman peak at 980 cm−1 is protein, and the increase in protein in the urine of MN patients correlates with the characteristic pattern of glomerular damage, a phenomenon that also corresponds to changes in the substance content54. The clinical manifestations of membranous nephropathy are accompanied by hyperlipidemia and glomerular lipid deposition, so the lipid content is increased55. In MN patients with impaired renal function, elevated uric acid occurs, and when guanine content increases, it leads to uric acid deposition in the organism56.
“