https://doi.org/10.3390/ma15228186
“The formation of ZnO nanomaterials from different Zn acetylacetonate precursor solutions was studied in situ by employing simultaneous, time-resolved X-ray diffraction (XRD) and X-ray absorption spectroscopy (EXAFS) at the Zn K-edge. The precursor solutions were heated from room temperature to the desired reaction temperatures in a hermetically sealed cell dedicated to X-ray experiments. In general, the first indications for the formation of hexagonal ZnO were found for elevated temperatures of about 80 °C both by XRD and EXAFS, and the contributions increase with temperature and time. However, no reaction intermediates could be proved in addition to the Zn precursors and the formed hexagonal ZnO materials. Furthermore, the results show that the efficiency of the reaction, i.e., the conversion of the precursor material to the ZnO product, strongly depends on the solvent used and the reaction temperature. ZnO formation is accelerated by an increased temperature of 165 °C and the use of 1-octanol, with a conversion to ZnO of more than 80% after only a ca. 35 min reaction time according to a detailed analysis of the EXAFS data. For comparison, an identical concentration of Zn acetylacetonate in water or dilute alkaline NaOH solutions and a reaction temperature of around 90 °C leads to a smaller conversion of approximately 50% only, even after several hours of reaction. The particle size determined from XRD for different orientations shows a preferred orientation along the c-direction of the hexagonal crystal system, as well in accordance with scanning electron microscopy. The LaMer model explained this highly non-uniform growth of needle-like ZnO crystallites.”
”
2.2. In Situ Reaction Cell
The reactions were performed in a dedicated, hermetically sealed reaction cell, as shown in . The main body of the cell with outer dimensions of 53 mm (width), 48 mm (length in the direction of the X-ray beam) and 102 mm (height) consists of a PTFE container in which the liquid precursor solution (maximum ca. 70 mL) is filled. Tests have shown that the electric heater attached to one side of the cell can heat the liquid sample solutions to a maximum temperature of ca. 300 °C, as measured with a platinum resistance thermometer encased in PTFE directly in the solution, and a second thermocouple fixed to the heater with a precision of ± 1 °C. The X-ray beam passes through the liquid sample volume about 20 mm above the bottom of the cell. It enters the cell via a small circular polyimide (Kapton) entrance window of 10 mm diameter and 25 μm thickness. The entrance and exit windows were mounted on specially designed PTFE frames employing a temperature and chemical-resistant adhesive (CMC 70110, CMC Klebetechnik, Frankenthal, Germany). It is important to note that the exit-window frame has a conical shape to allow scattering angles of up to 40°. The frames with the windows, as well as the top flange of the cell, are screwed to the main body and sealed by Viton O-rings of a suited diameter (see ). Moreover, the effective thickness of the probed sample can be varied by varying the length of the window frames so that a reasonable X-ray absorption is achieved on the one hand while the diffracted volume is kept small enough to reduce the broadening of the Bragg peaks on the other. To guarantee a homogenous temperature distribution within the cell and to avoid precipitation of reaction products at the cell walls and the windows, a magnetic stirrer actuated by a brushless motor in the cell holder below the liquid were employed. The stirrer, as well as the control of the heater and the temperature readouts, were remote-controlled via a Raspberry Pi with an Ethernet connection.
Figure 1. Schematic drawing of the reaction cell for hydrothermal/solvothermal preparation of ZnO nanomaterials. The X-ray beam passes from the right to the left.
”
”
3.2. X-ray Diffraction
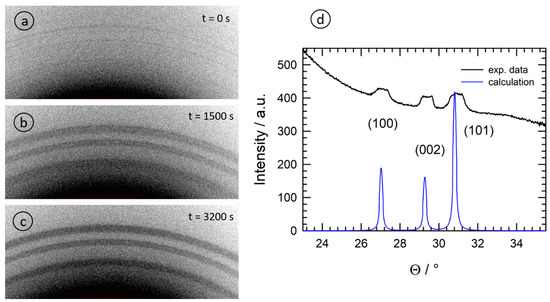
Some selected examples of two-dimensional XRD images recorded in parallel to the X-ray absorption measurements employing a photon energy of 9.423 keV (X-ray wavelength λ = 1.3158 Å) are presented in . The data collected on the different pixels of the X-ray detector were converted into conventional powder diffractograms and evaluated using the pyFAI software [
42]. In comparison to a calculated diffractogram using the structure data of Wurtzite ZnO as already detailed above (PDF file no. 01-079-2205, [
38]), it can be concluded that all samples only reveal the expected ZnO diffraction peaks, with the (100) peak at Θ
B = 27.0°, the (002) reflection at Θ
B = 29.3° and the (101) with Θ
B = 30.8°, which implies that the reaction product ZnO can also be detected via the XRD measurements. In agreement with the EXAFS measurements, the presence of ZnO took place with a slight time delay after the initiation of the reaction since a certain volume of crystalline ZnO must first be generated depending on the solution and the temperature. It was only in the reaction of 1-octanol (sample O) that very weak Scherrer rings were detected directly after initiating the reaction (see a).
Figure 7. Selected diffraction patterns collected during the solvothermal reaction of Zn(acac)
2 in 1-octanol (sample O) for a photon energy of 9.423 keV; (
a) t = 0 s; (
b) t = 1500 s; (
c) t = 3200 s. In (
d), the diffractogram calculated by azimuthal integration is compared to a theoretical calculation for ZnO having Wurtzite structure without any preferential orientation (space group P
63mc, a = b = 3.251 Å, c = 5.207 Å; α = β = 90°, γ = 120°, [
38]).
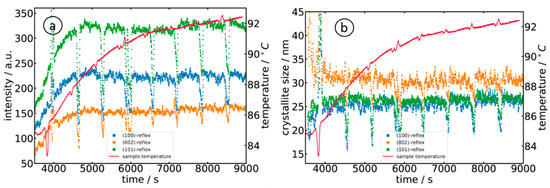
For further data analysis of the diffractograms, a polynomial background was subtracted from the diffraction data, followed by a peak fitting with three individual Gaussian peak functions. The evolution of the measured peak intensities of the (100), (002) and (101) reflections is displayed in a for sample A, i.e., the reaction of Zn(acac)2 in 10−3 M NaOH. The three peaks showed an identical trend, i.e., continuously increasing to a maximum intensity at about 6000 s (T ≈ 90 °C). As can already be seen in , the detected diffraction peaks exhibited considerable broadening due to the finite length of the X-ray path through the solution containing the nanoparticles, i.e., a particle located closer to the entrance window of the cell shows up at a position further away from the direct beam, while a particle located close to the exit window shows up at a correspondingly shorter distance. Assuming that the particles are homogeneously distributed in the liquid phase, a peak with a flat top can be expected. Such a trend is also experimentally observed by looking at the measured intensity distributions on the flat-panel detector and the extracted diffractogram (d). In any case, this broadening must be considered carefully when the peak width is used for an estimation of the crystallite size L, e.g., by employing the Scherrer formula [43]
where λ = 1.3158 Å, β is the full width at half maximum of the considered Bragg peak, Θ is the position of the Bragg peak, and K is the Scherrer constant with a value of 0.9 [43]. The crystallite sizes for the above-mentioned orientations are accordingly determined and plotted in b. Similar to the temporal evolution of the intensity, the crystallites grow to a size of about 25 nm ((100) and (101) orientation) and 30 nm ((002)-orientation). The temporal evolution of the diffraction peaks is well in accordance with the presence of small, hollow nanoparticles, which is usually observed in dilute alkaline solutions (see, e.g., refs. [5,10,11]).
Figure 8. Evaluation of the diffractograms collected during the reaction of Zn(acac)2 in 10−3 M NaOH (sample A) as a function of time and temperature: (a) temporal evolution of the diffraction peak intensities and (b) evolution of the crystallite size as calculated by the Scherrer equation. The periodic drops in intensity and crystallite size are due to the periodic interruption of the stirring process, so the particles in the solution tend to move out of the volume probed by the X-ray beam.
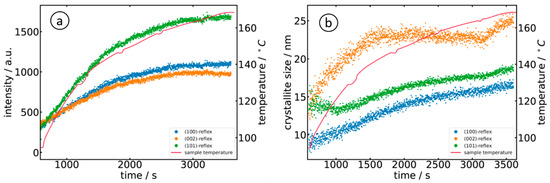
In contrast, the use of organic solvents, such as triethanolamine [
10], polyvinyl-pyrrolidone [
27] or cetyl-trimethyl ammonium bromide [
12], lead to needle- or flower-like nanocrystallites with stronger contributions of the otherwise weaker (002) Bragg reflection, and very intense (101) peaks compared to the ZnO reference without a preferred orientation (see the calculation in d). This exact behavior was observed in the present study using 1-octanol as a solvent.
Comparing a and a, we notice the lower intensity of the (002) reflection in the case of the alkali compared to the (100) peak, as well as the dominant (101) reflection and the nearly equal intensities for (100) and (002) for the organic solvent (sample O). It is interesting to note that the intensity (peak area) of the (101) reflection exactly follows the course of the temperature during the reaction, thereby offering an opportunity to manipulate the growth easily. Such behavior is also well in-line with linear growth behavior [
44,
45]. The evaluation of the crystallite size further shows that the crystallites obey a larger and faster growth along the
c-axis ((002)-reflection) in the first ca. 1500 s of the reaction, which is in agreement with the presence of needle-like crystallites. The growth of the (100)- and (101)-oriented crystallites was rather slower.
Figure 9. Evaluation of the diffractograms collected during the reaction of Zn(acac)2 in the 1-octonal (sample O) as a function of time and temperature: (a) temporal evolution of the diffraction peak intensities and (b) evolution of the crystallite size as calculated by the Scherrer equation.
The comparison of the crystallite size found for the two experiments shows that crystallites are slightly larger for the reaction of Zn(acac)
2 in 10
−3 M NaOH (sample A), with values of 31 nm ± 2 nm for the (002)-direction and slightly smaller values for (100) and (002) orientations, i.e., 25 nm ± 2 nm after about 4500 s (75 min). When prepared in 1-octanol (sample O), the crystallites were smaller, with a maximum of about 25 nm for (002) and much smaller values for (100) and (101), but with a shorter reaction time of less than one hour. Thus, the particles produced in 1-octanol were significantly smaller than in the NaOH sample, even though identical Zn(acac)
2 concentrations of the precursor solutions were initially used. The smaller crystallite size in (100) and (101) correlates well with the preparation of hollow nanostructures [
11]. Since the diffracted intensity of the diffraction pattern is proportional to the volume leading to the diffraction of the radiation, it can be concluded from the measured Bragg intensities and particle sizes that more, but smaller, nanoparticles are formed in 1-octanol (sample O) than in the alkaline solution (sample A).
Electron microscopy measurements on particles using similar synthesis processes involving, however, a longer synthesis time of several hours or even days showed particle sizes of several hundred nanometers [
4,
7,
11,
12]. This indicates that the growth of the ZnO nanoparticles is comprised of the formation of small hexagonal nuclei in the initial stages of growth and a subsequent, temperature-controlled, and eventually non-isotropic growth by diffusion, depending on the solvent. The agglomeration of particles is presumably responsible for the decreased growth rates observed in the alkaline solvent in the later stages of the growth, as all the precursor material in close vicinity of the grown crystallites was already consumed.
“